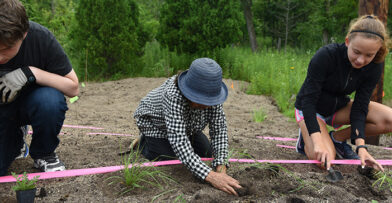
Our conservation team is currently surveying the vegetation growing within 256 individual sections of our 185 acres, conducting a land management stand assessment throughout our woodlands, prairies, and wetlands. They are working to get a high-level understanding of the vegetative material growing in each of these areas. This assessment will provide impactful insights to inform present and future conservation activity.
A stand is an area of the property that exists as a unit. Vegetation throughout a stand is ubiquitous and is therefore treated in the same way. This includes canopy trees, sub-canopy trees, shrubs, and ground layer vegetation. Each of the 256 sections on the Schlitz Audubon property is a stand, which are different sizes and have unique conditions.
The size of a stand, as well as the land’s complexity, can determine the time it takes to do an assessment. Stand 2A, east of the main building, is our smallest at .038 acres, and stand 7, next to Doctor’s Park, is the largest, with 6.6 acres.
The Center’s stands were created in 2014-2015, when the conservation team formulated our 15-year Conservation Plan. The process started by looking at aerial photography of our property to view where clusters of similar species were located. Staff created a rough sketch of potential stands and then surveyed the land, adjusting the stands’ borders based on their on-the-ground habitat observations.
The Purpose of Stand Assessments
Dividing land into stands is a common practice in land management. It helps conservation teams track species and changes in habitat over time. Conservation work benefits from the methodical process of the stand-by-stand vegetative surveys, which allow the team to maintain orderly restoration work.
Drew Shuster has worked at the Center since 2015 and knows the Center’s land well. Since becoming our Director of Conservation last year, he has maintained the importance of these surveys. When a land manager wants to know the land, Drew said, a stand assessment is the first and best thing to do.
Since the 2014-2015 stand assessment, the team has made progress removing invasives, restoring many areas of the property, and increasing biotic diversity, resulting in higher quality habitats. The current assessment will help the conservation team plan for the next five years of land management and indicate progress towards the 2030 Conservation Goals.
Performing a Stand Assessment
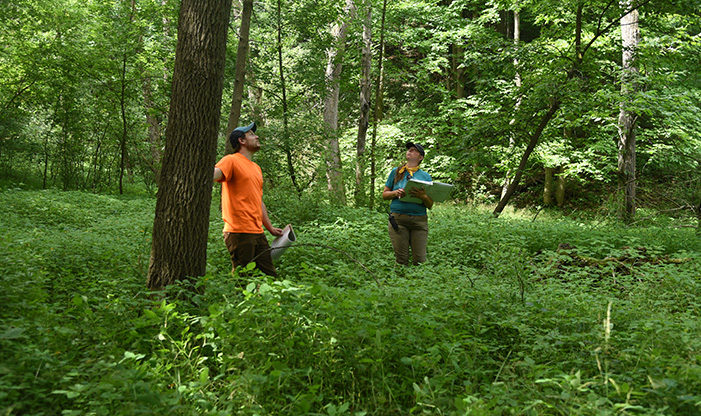
To illustrate the process, Drew and Center Land Manager Sarah Long conducted a survey on stand 15A, which runs along a trail on the terrace and borders the bluff on the north. They found the edges of this stand by looking at both a paper map and the GPS system on their phone. To begin the assessment, they walked the area, on and off-trail, to get an idea of what is growing there. Then, they began recording observations, starting with the canopy, or the highest-level trees.
Measuring the percentage of open space versus how much space is filled, they determine the scope of the canopy. They noted variability within this stand as the canopy has changed due to emerald ash borer. When there is loss to the canopy, it opens the ground to new growth, accounting for many changes in wooded areas.
The Abundance of Trees
The percentage of coverage for this stand of forest is now 25% canopy, which is broken down into categories, first determining whether trees are native or non-native species. Native species are found in an ecosystem due to natural processes, such as natural distribution. Non-natives are not indigenous to a given area. Of the canopy trees, there is often a dominant species, but in this stand, currently there is none.
Species in the stand are then labeled common, uncommon, or rare. These terms refer to a tree’s abundance within the stand, not its status as a tree. The last step for each layer of vegetation is to find the individual species. In stand 15A’s canopy, Drew and Sarah found that basswood and box elder are common, black walnut is uncommon, and white ash is rare.
The team does the same calculation for the sub-canopy, which consists of smaller trees just below the canopy. If canopy trees fall, they are replaced by sub-canopy trees. Here, the team found a coverage of 65%. Common natives are box elder, and ash. Rare trees are oak and black walnut. While the previous survey indicated 5% non-native trees, they are no longer present due to the team’s conservation work.
Next, the team measured the shrub layer. There are many definitions of shrub vs tree, but typically shrubs are between three to fifteen feet tall. In this stand, the team found 25% shrub coverage, all native species, with none being dominant. Black cherry is common, box elder is uncommon, and elderberry is rare within the stand. It contains 3% ash trees.
The Complex Ground Survey
Surveying the ground layer takes more time and is more complex. Land managers search for open space, or the amount of light hitting the ground and soil. These are spots that invasives may fill, as they thrive on disturbance. Wooded areas have more bare ground compared to prairies, which have almost zero. The amount can also vary by time of year – the ground is filled by ephemerals.
This layer contains more categories of plants living within the same space but occupying several layers. In the filled spaces, the team looks for a dominant species and measures for native and non-native herbaceous plants, graminoids (grasses, sedges, and rushes), and plants that are woody, such as tree seedlings and small shrubs. In this case, the team noticed that open ground was 20%, or 80% filled. Some of the species in the ground layer include the dominant jewel weed, and common occurrences of wild geranium, Canada goldenrod, black snakeroot, and many more. Uncommon plants include Virginia water leaf, cow parsnip, and creeping Charlie, among others. Creating a species list for the ground layer can take longer due to the sheer number of plant types and categories.
What the Results of the Survey Mean
Drew and Sarah compared this survey of stand 15A to notes taken from the last assessment in August of 2014, looking for the differences. The team didn’t expect major changes or additional species except where work was done. The change in overall quality of habitat was also considered, reflected in a C value.
The Coefficient of Conservation (C value) is a number determined by scientists that refers to a plant species’ probability of growing in areas unchanged from conditions present before European settlement. Only native species are given this value, and species with a coefficient of 0-1 will grow almost anywhere. A coefficient of 10 means the plant needs very specific conditions and is very susceptible to disturbance. Rare plant species have high C values. Plants with low values will outcompete plants with high C values, and invasives knock out everything.
All stands are assigned a mean, or average C value, based on the C values and prevalence of the plants within the stand. The conservation team assigned the stand’s habitat a C value of four, an increase from the mean C value of two in 2014. This increase was expected, as invasives and ash had been removed from this stand since the last survey. The goal of restoration work is to increase a stand’s C value over time.
The Final Steps
Management recommendations constitute the last step in an assessment. The strategy for managing stand 15A will change because invasive removal by mowing was so successful. The stand now has desirable vegetation, so moving forward, hand pulling garlic mustard and dame’s rocket that arise from remaining seeds is chosen to maintain the native population.
This assessment work will continue into the fall, stand by stand, until it is complete. Management recommendations will be revised to ensure progress towards our 2030 conservation goals. Visitors to the Center will see the rewards of this work for years to come.
Written with contributions from Sarah Long and Drew Shuster